Welcome | Get started | Dive | Contribute | Topics | Reference | Changes | More
More about display modes
When you have defined a data table, Lino can display it in different ways, called display modes.
This page contains code snippets (lines starting with >>>), which are
being tested during our development workflow. The following
snippet initializes the demo project used throughout this page.
>>> from lino_book.projects.cosi1.startup import *
Overview display modes
Lino knows six display modes. We explained them already in Display modes, but they are once more :
‘grid’ (default) renders a set of rows as an editable grid, similar to a spreadsheet.
‘detail’ renders one row at a time
‘html’ renders it as a read-only table in simple html.
‘summary’ renders it as a summary in a single paragraph
‘list’ renders it as a list of customizable items
‘cards’ renders it using customizable “cards”
‘gallery’ renders it as a photo gallery
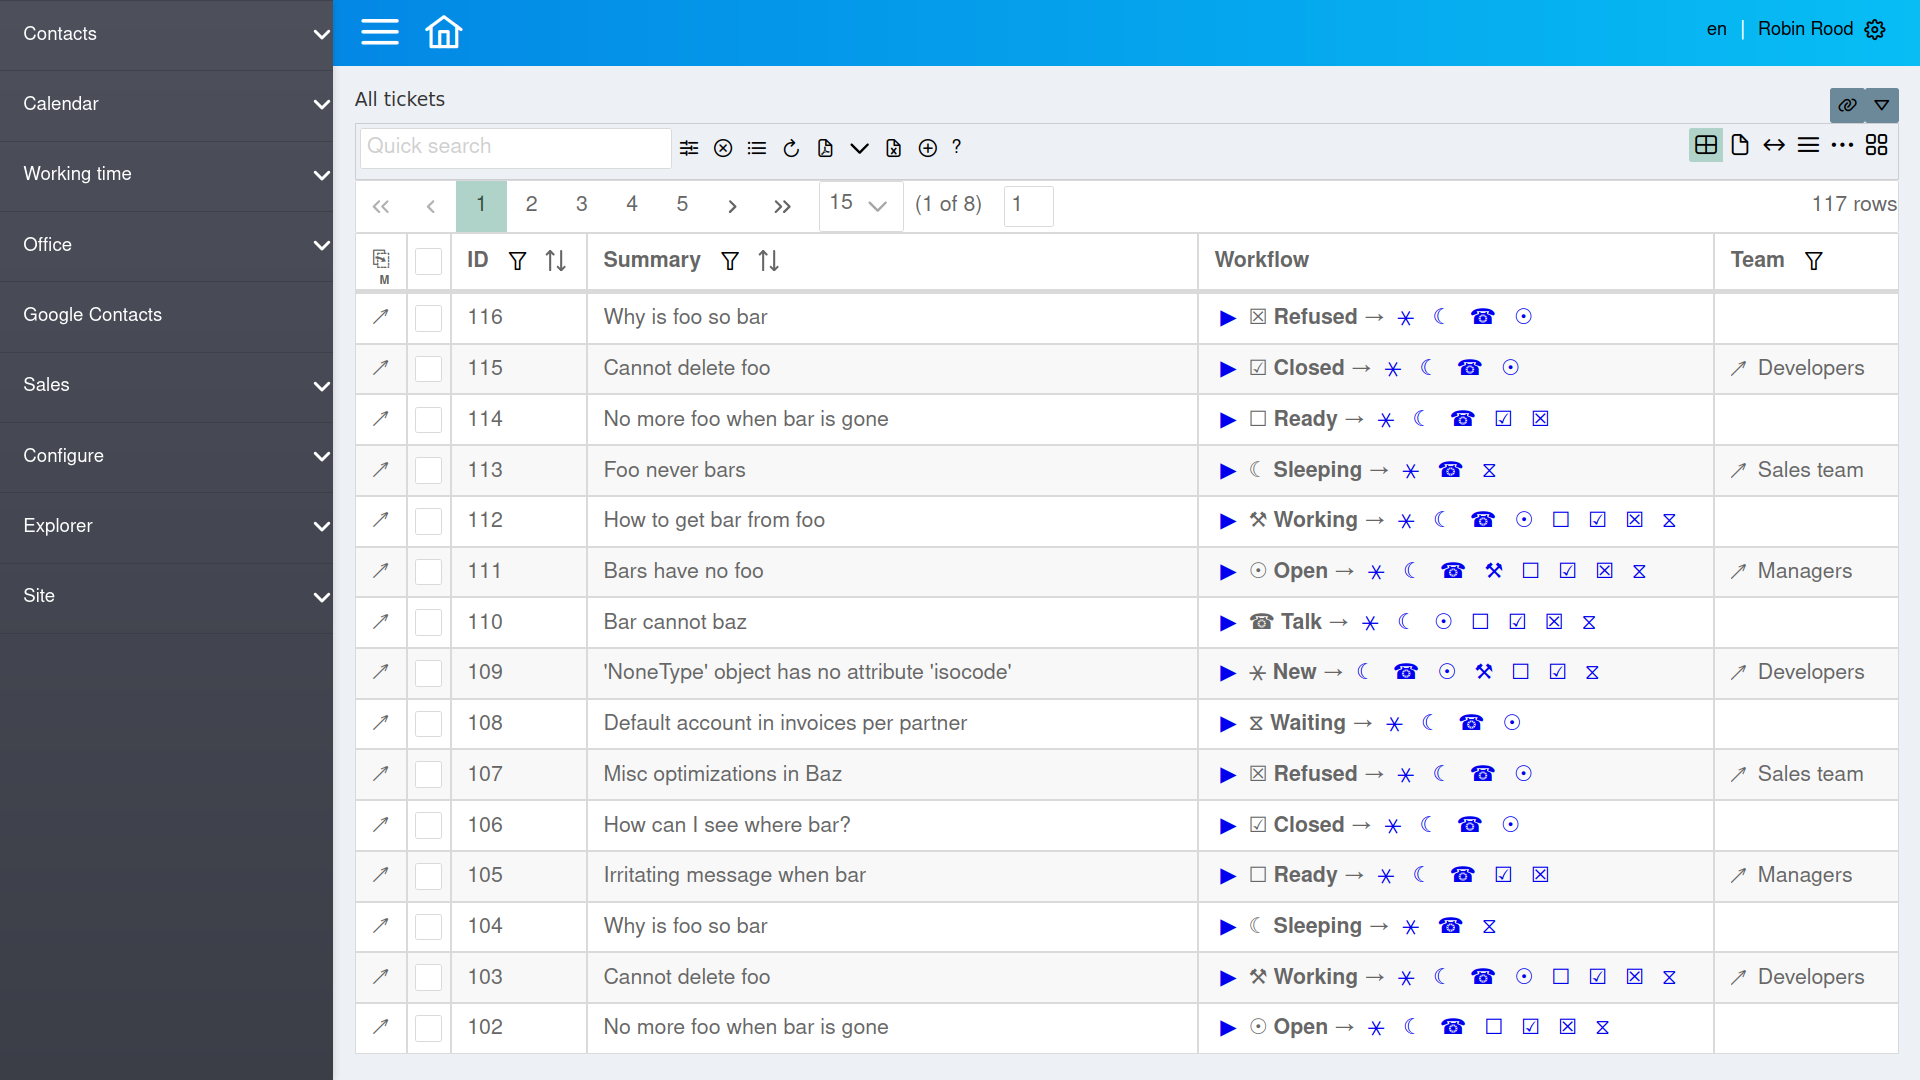
grid
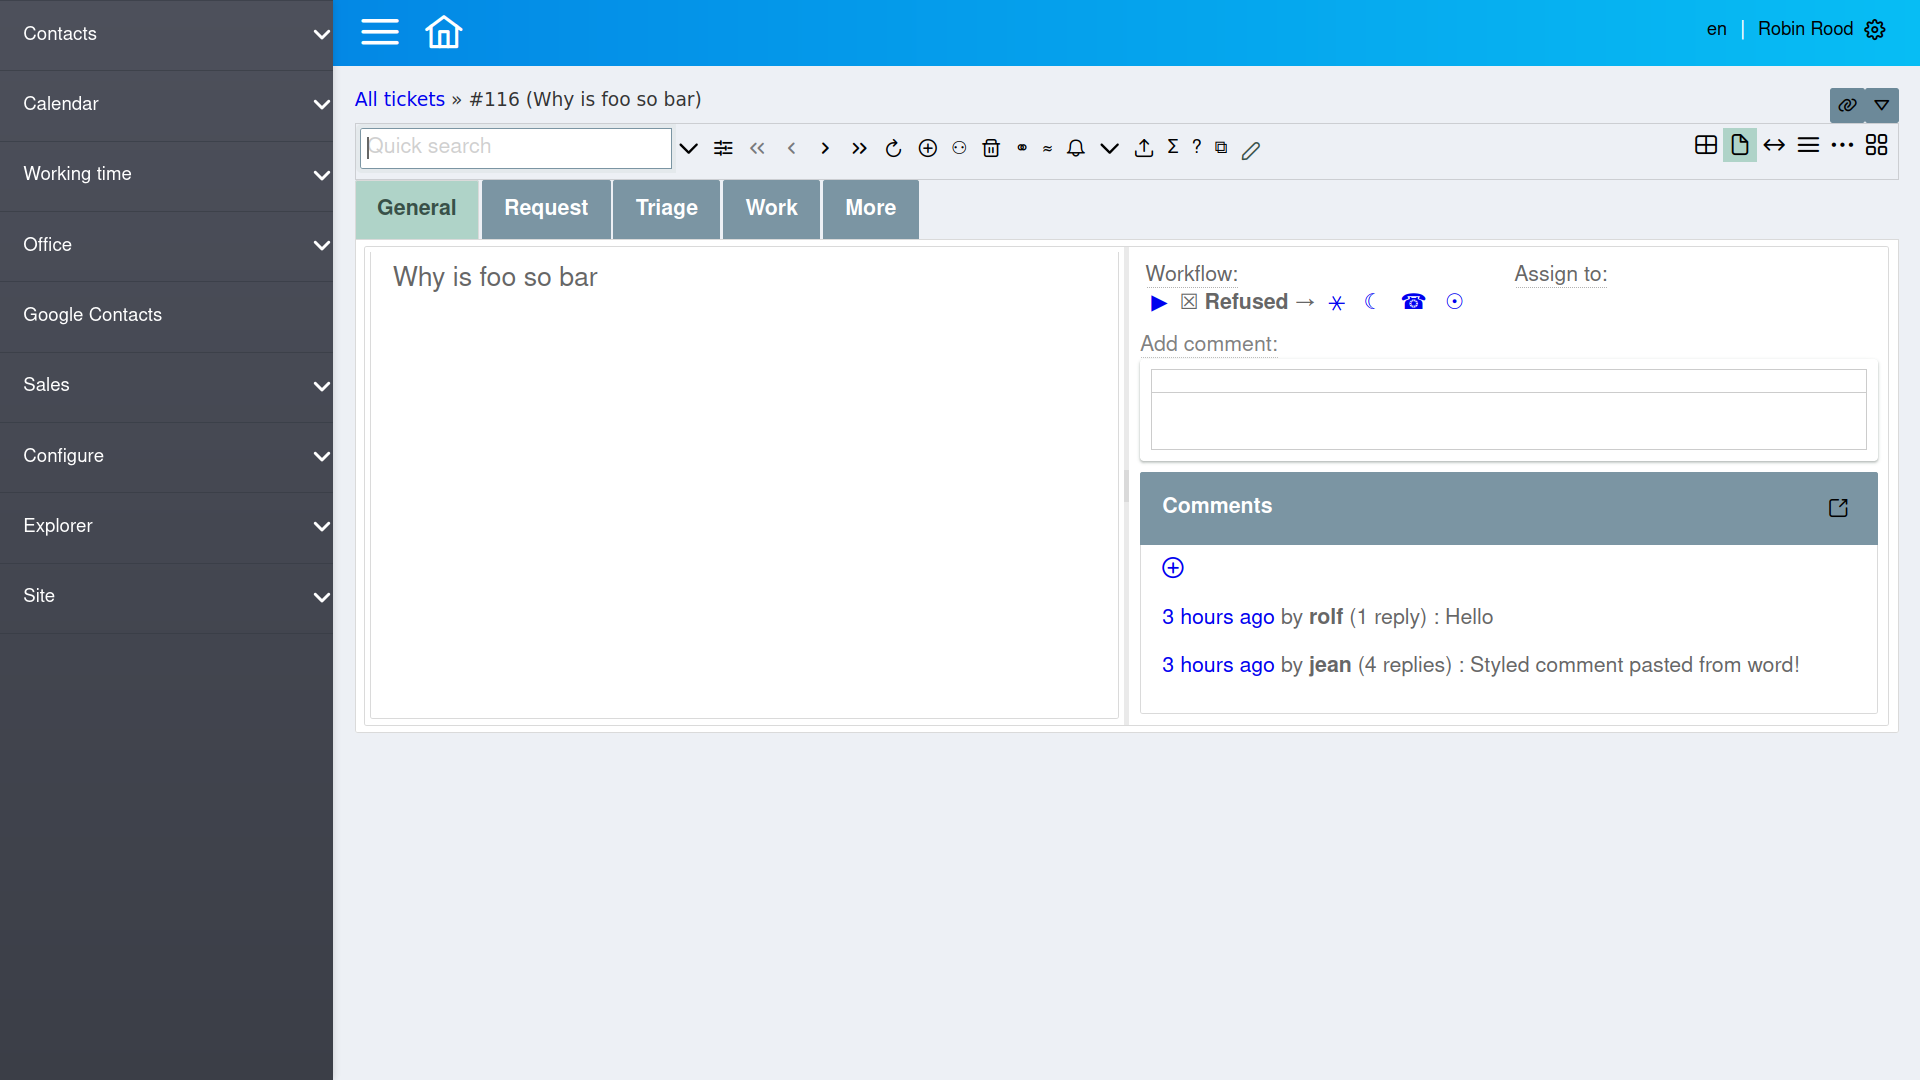
detail
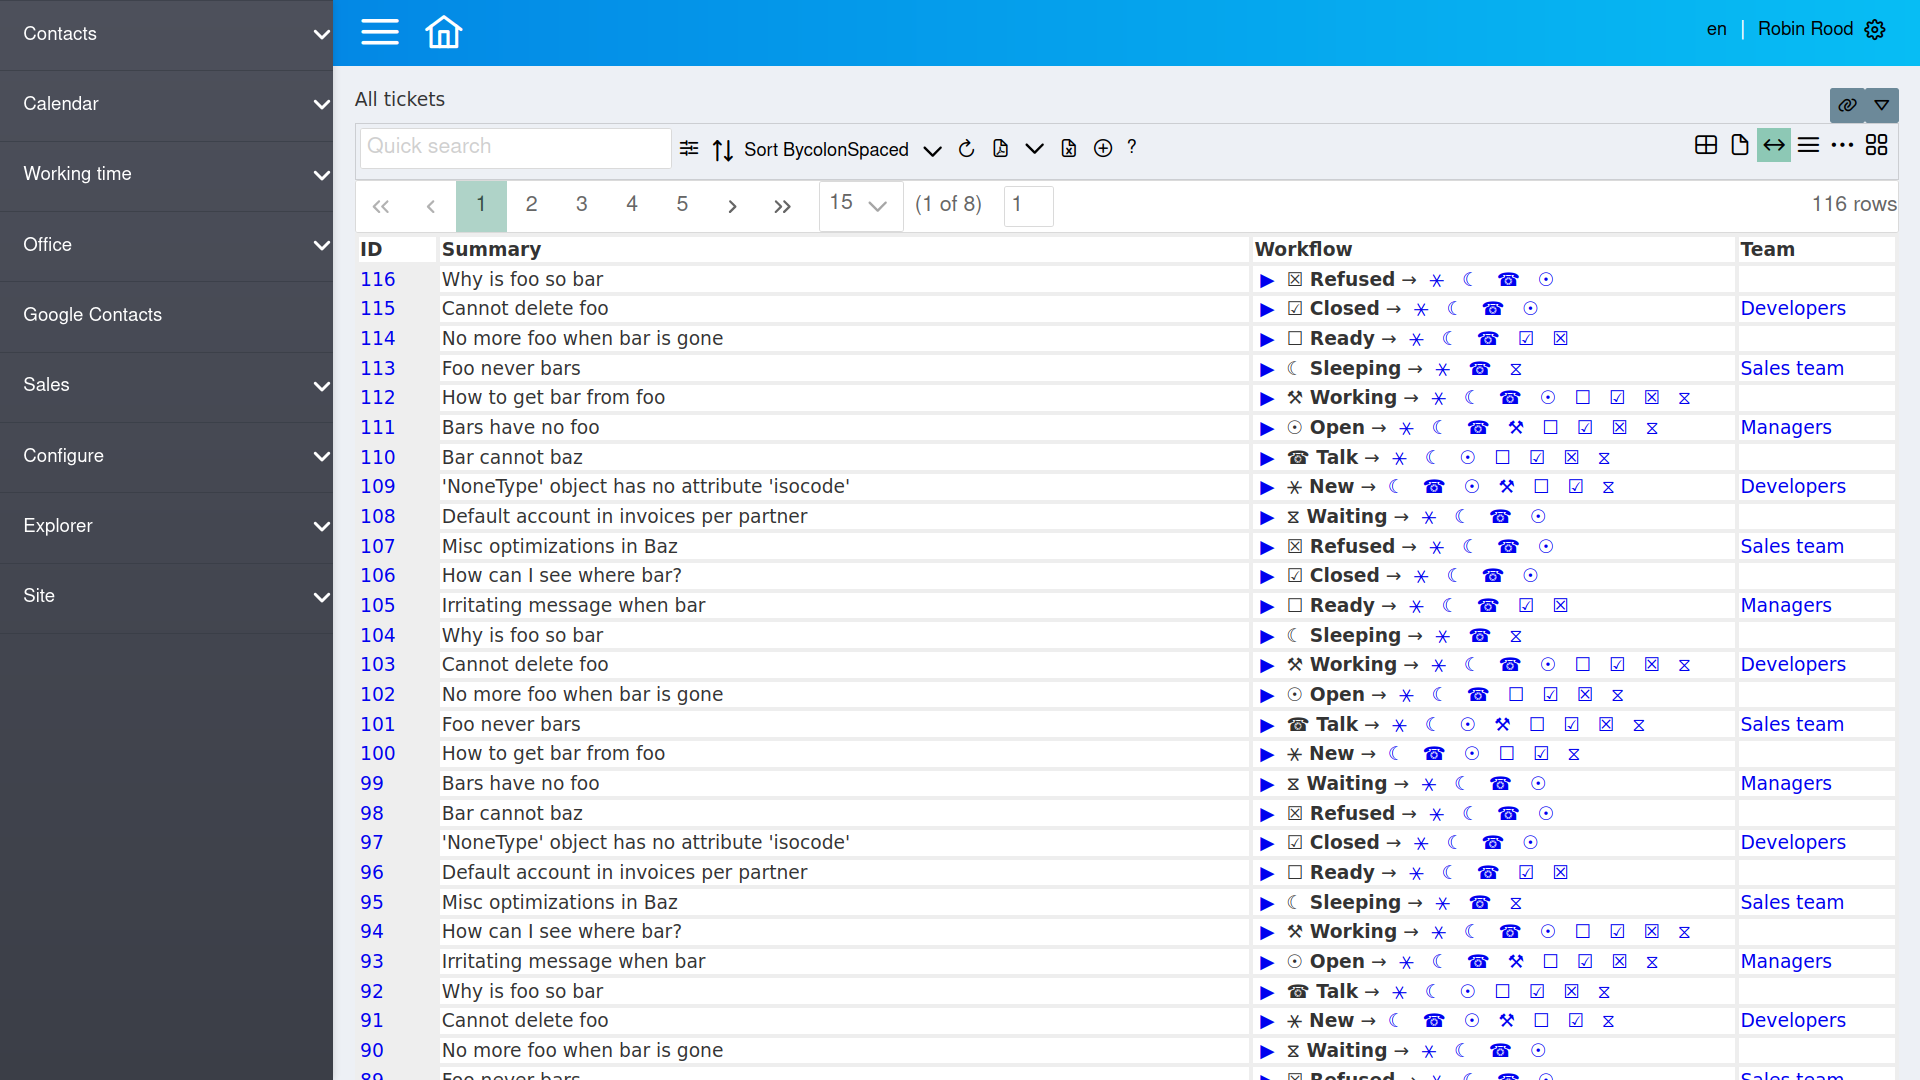
html
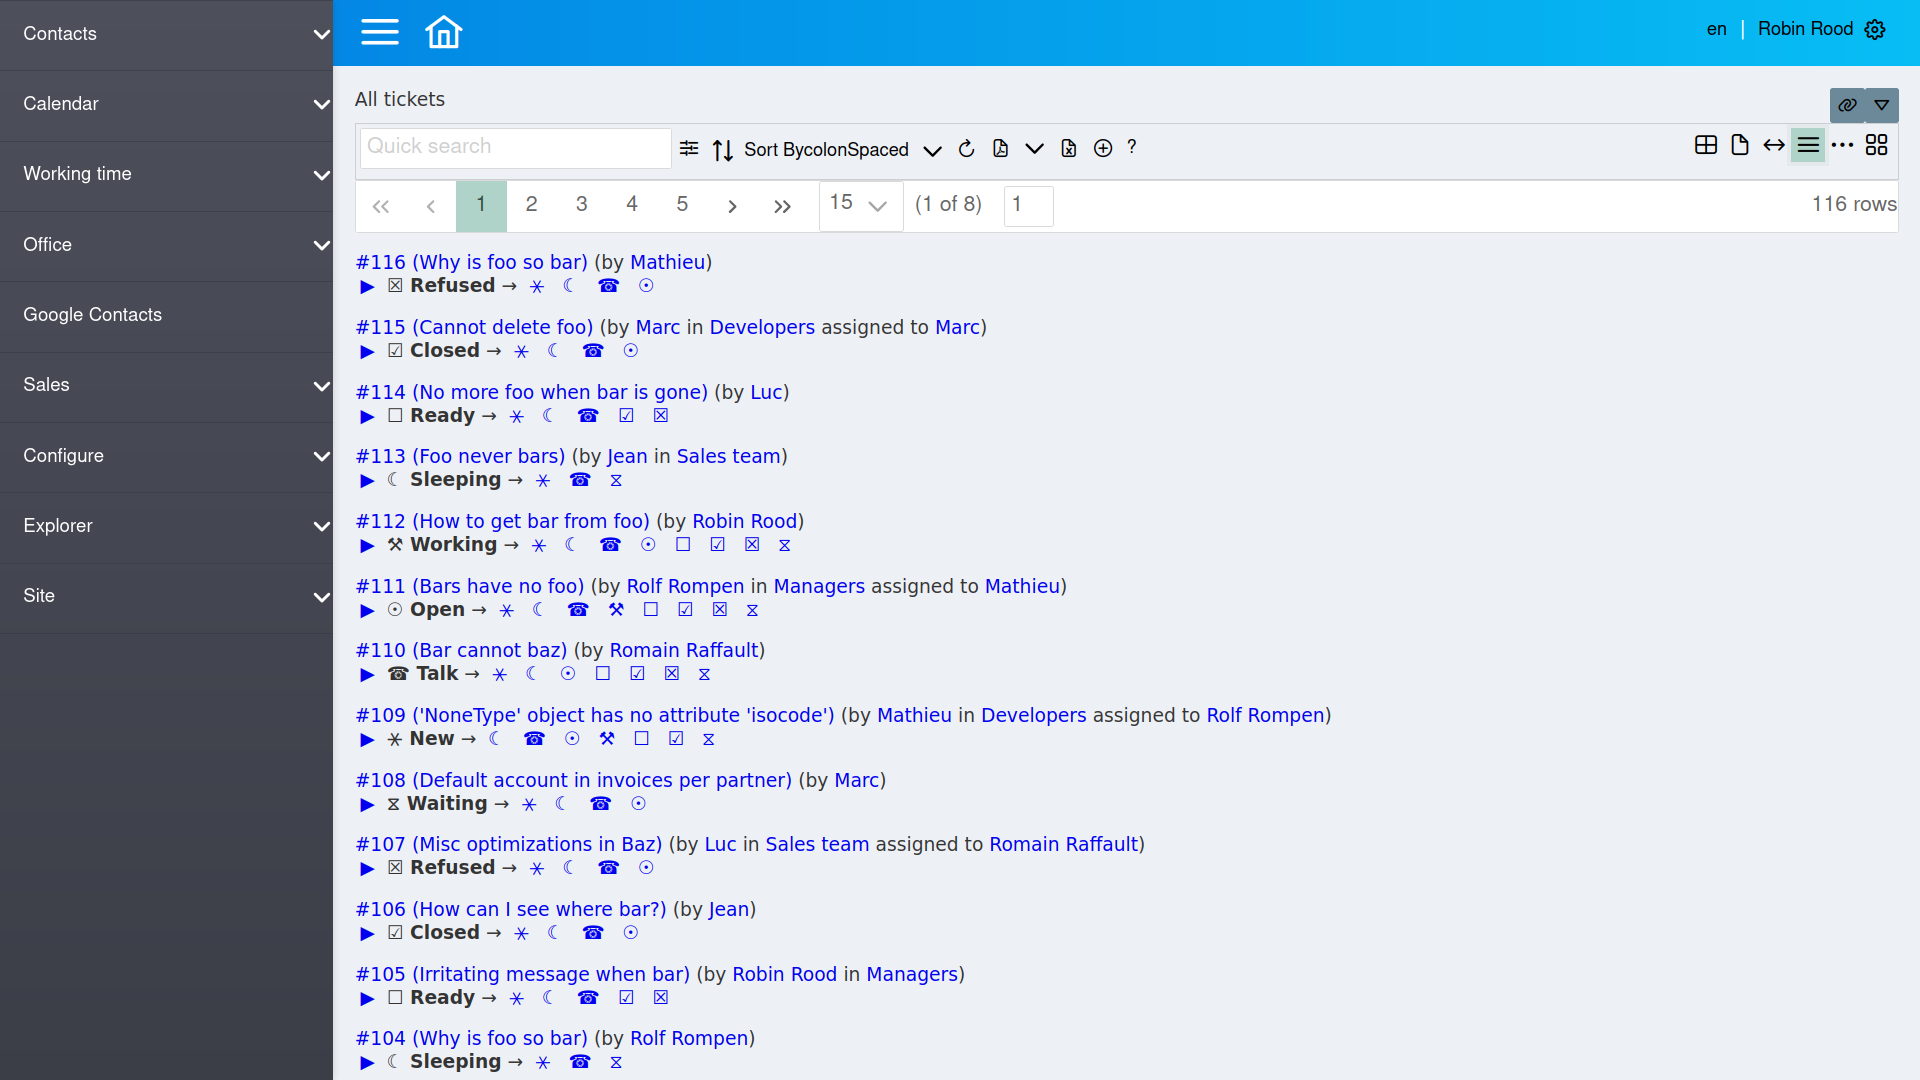
list
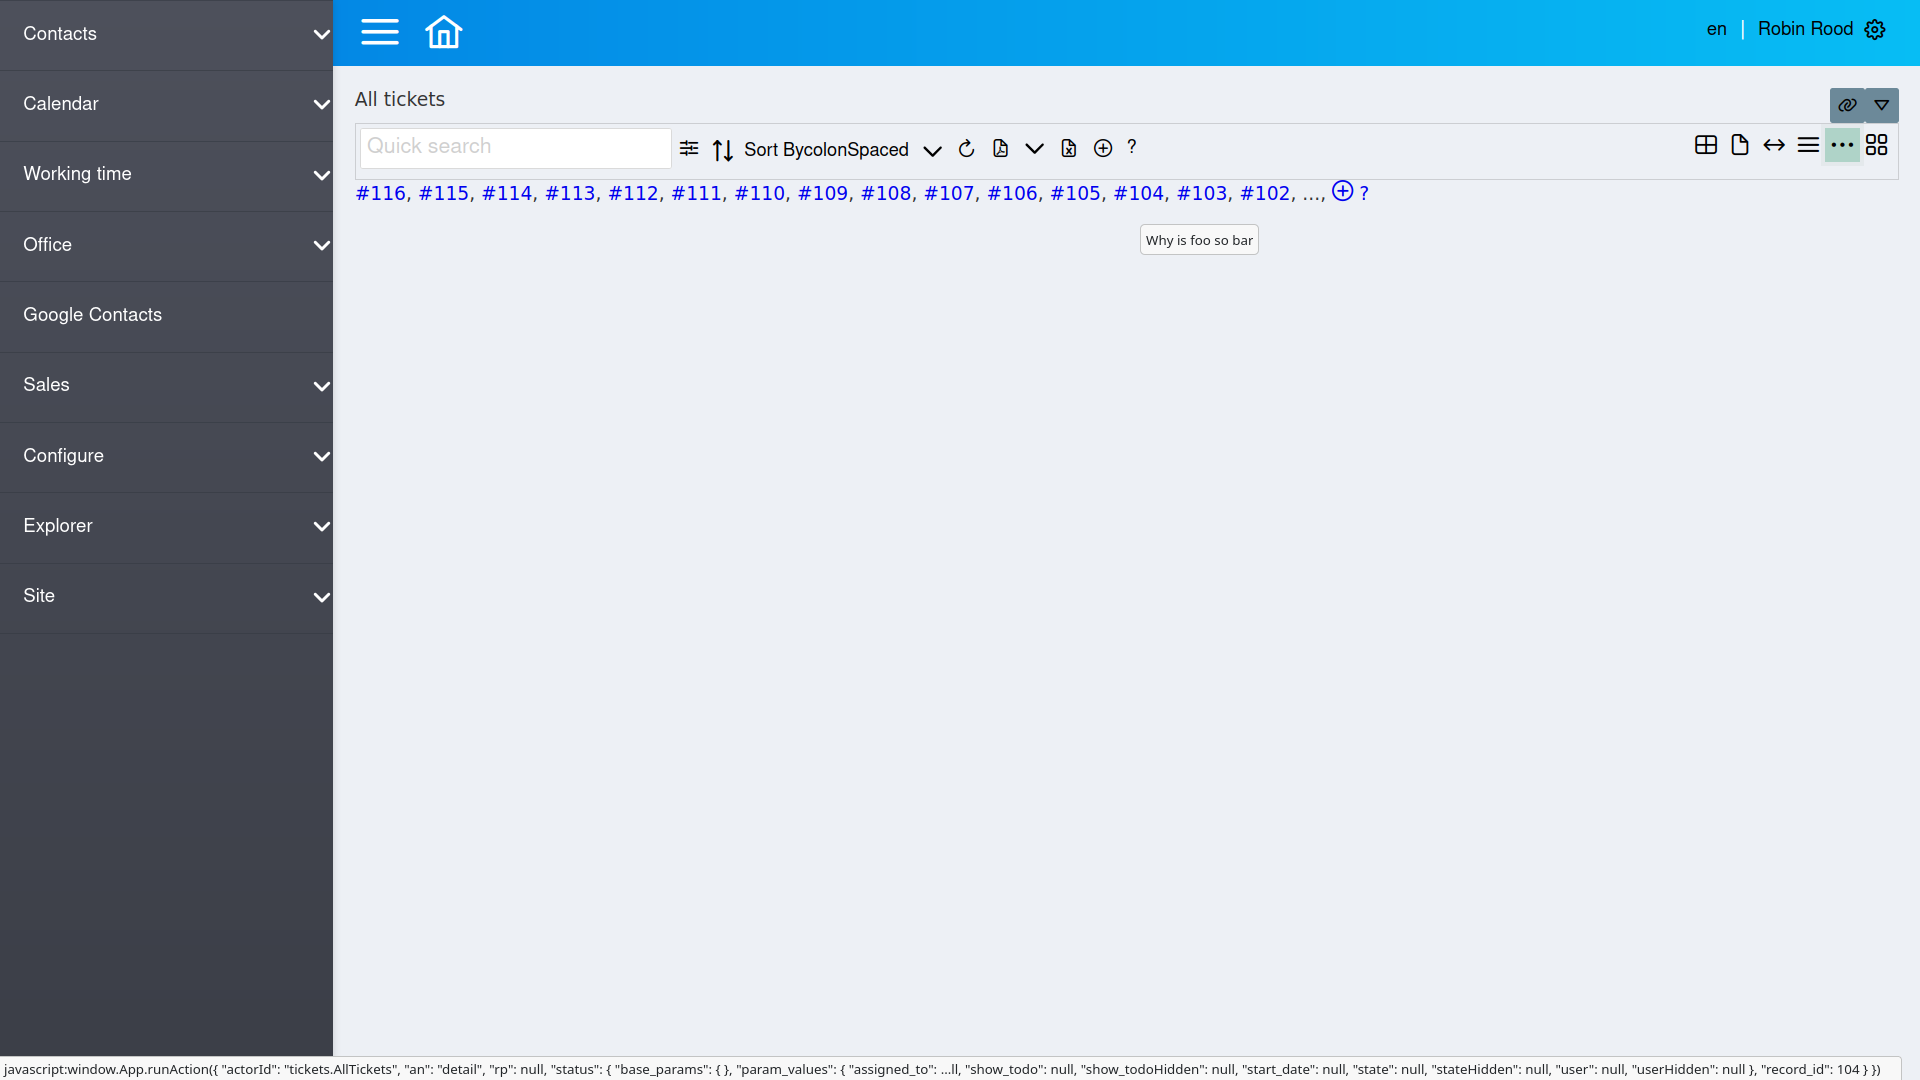
summary
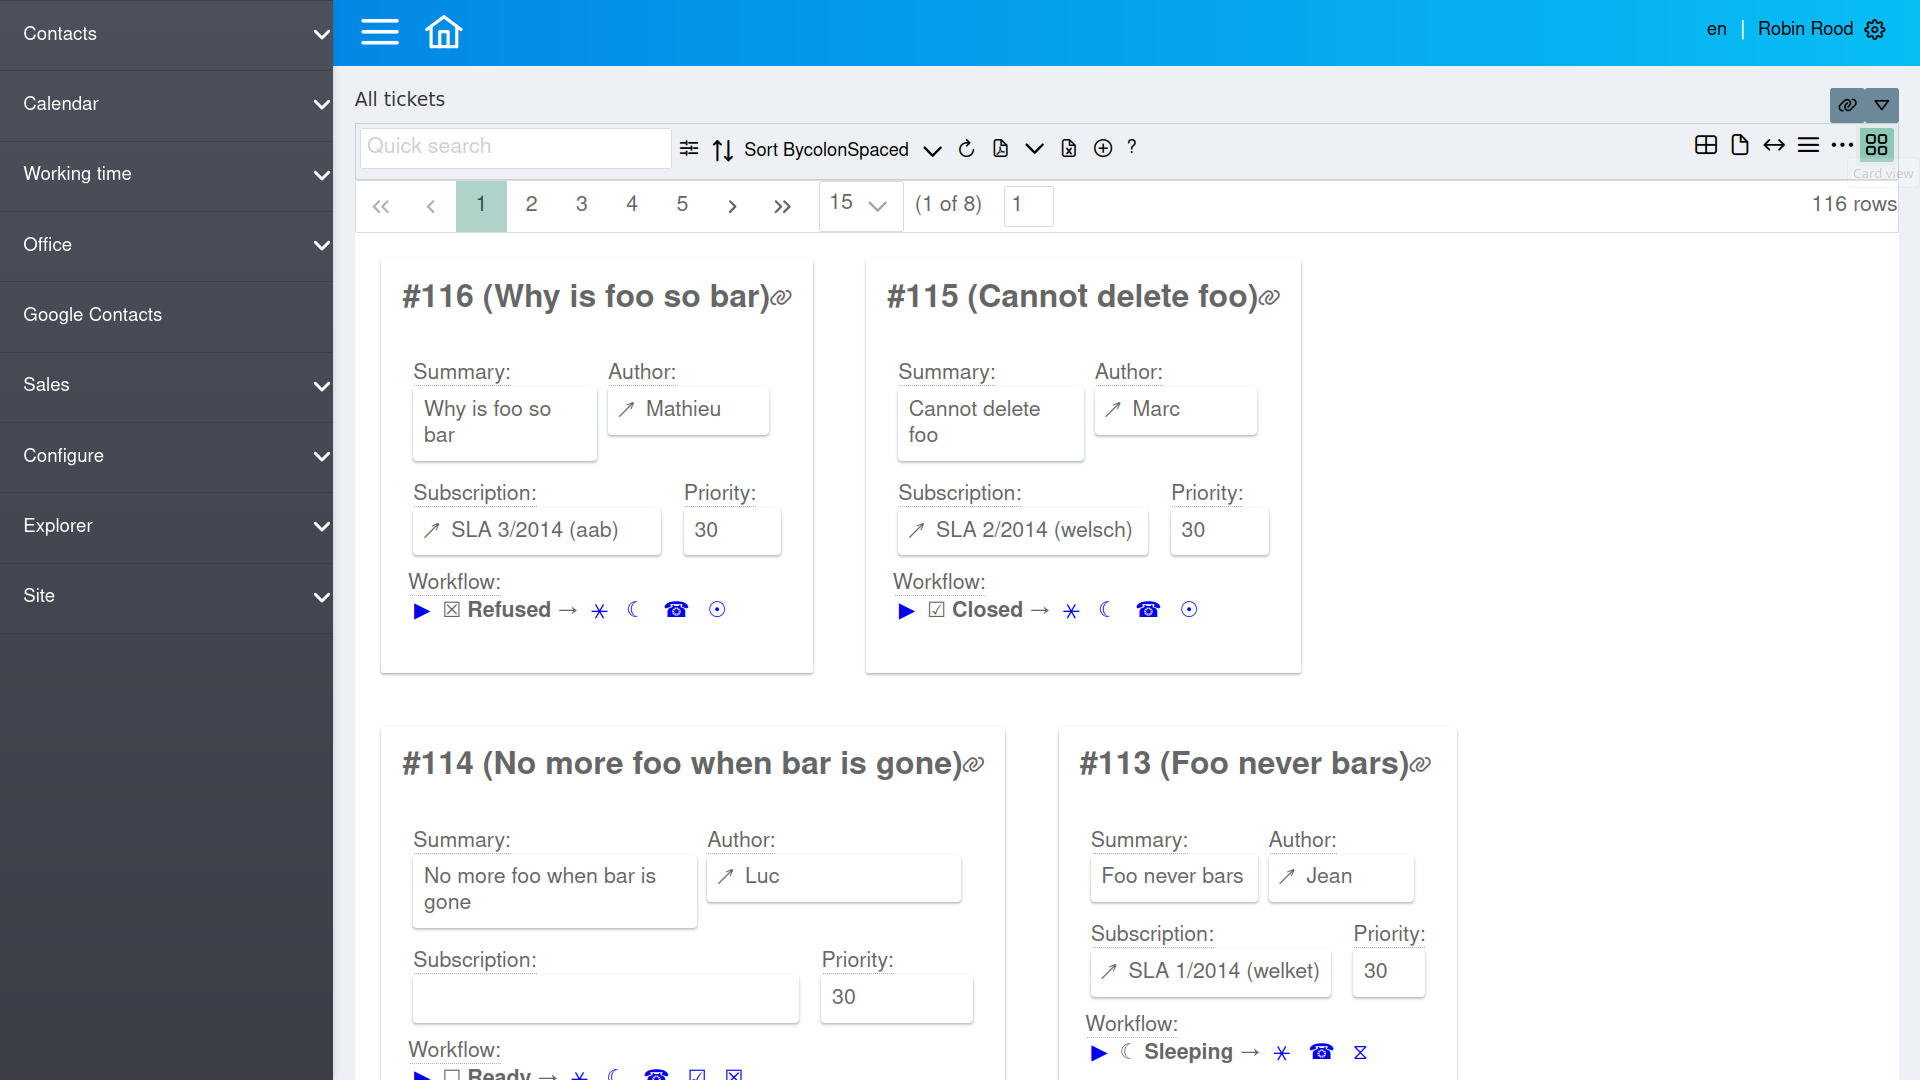
cards
The two basic display modes are “grid” and “detail”. They are explained in the Data windows section of the user guide.
The display modes ‘cards’, ‘list’ and ‘gallery’ don’t exist in the ExtJS front end.
On a site with React front end, end users can select the display mode using the group of buttons on the right side of the table toolbar:
Naming display modes from application code
The lino.core.constants module defines a full name for each display mode.
It is recommended to use these constants rather than the actual short names.
>>> from lino.core import constants
>>> for k, v in sorted(constants.__dict__.items()):
...     if k.startswith("DISPLAY_MODE_"):
...         print(f"{k} = {repr(v)}")
DISPLAY_MODE_CARDS = 'cards'
DISPLAY_MODE_DETAIL = 'detail'
DISPLAY_MODE_GALLERY = 'gallery'
DISPLAY_MODE_GRID = 'grid'
DISPLAY_MODE_HTML = 'html'
DISPLAY_MODE_LIST = 'list'
DISPLAY_MODE_STORY = 'story'
DISPLAY_MODE_SUMMARY = 'summary'
DISPLAY_MODE_TILES = 'tiles'
>>> sorted(constants.DISPLAY_MODES)
['cards', 'detail', 'gallery', 'grid', 'html', 'list', 'story', 'summary', 'tiles']
Setting the default display mode
The application developer can specify the default display mode to use by setting
the default_display_modes
attribute of a table. Its default value is:
default_display_modes = {
    70: constants.DISPLAY_MODE_SUMMARY,
    None: constants.DISPLAY_MODE_GRID
}
It reads “when there are less than {key} characters available, use display mode {value}”.
The default_display_modes
attribute of a table is a dict that maps available widths (in
characters) to the name of a display mode to use. The keys of this mapping
must be either an int or None, and each value must be one of the
names specified in lino.core.constants.DISPLAY_MODES. There must be at
least an item for key None.
In real life you will probably always use two keys, 70 and None. 70 means “when there is less than 70 characters of available width”, and None means “in all other situations”.
See also How to represent a database row.
Activating extra display modes
As an application developer you can decide to let the end user dynamically select another display mode than the default one.
You do this by specifying the extra_display_modes attribute on a Table or a Model.
On a model this attribute defaults value to None, on the Table its default
value is:
extra_display_modes = {constants.DISPLAY_MODE_HTML}
If you want to remove the possibility to select summary mode, override this to an empty set:
extra_display_modes = set()
In some cases you won’t need to set extra_display_modes because Lino
adds extra display nodes automatically in some situations:
Any (non-basic) display mode mentioned in
default_display_modeswill automatically be added toextra_display_modes.When you define a
row_as_paragraph()on a Table or aas_paragraph()method on a model, Lino will automatically addDISPLAY_MODE_LISTtoextra_display_modes.When you define a
card_layouton a Table, Lino will automatically addDISPLAY_MODE_CARDStoextra_display_modes.When you define a
as_page()method on a Model, Lino will automatically addDISPLAY_MODE_STORYtoextra_display_modes.
Customize the summary view
The summary view is an alternative way of displaying a data set in a single paragraph.
The default summary view simply displays a comma-separated list of all rows
using their __str__() method (but each row is clickable), potentially
followed by an insert button or other actions.
You can customize the summary view by overriding the table_as_summary method.
For example the detail window of a client in Lino Welfare has several slave panels with customized summary views:
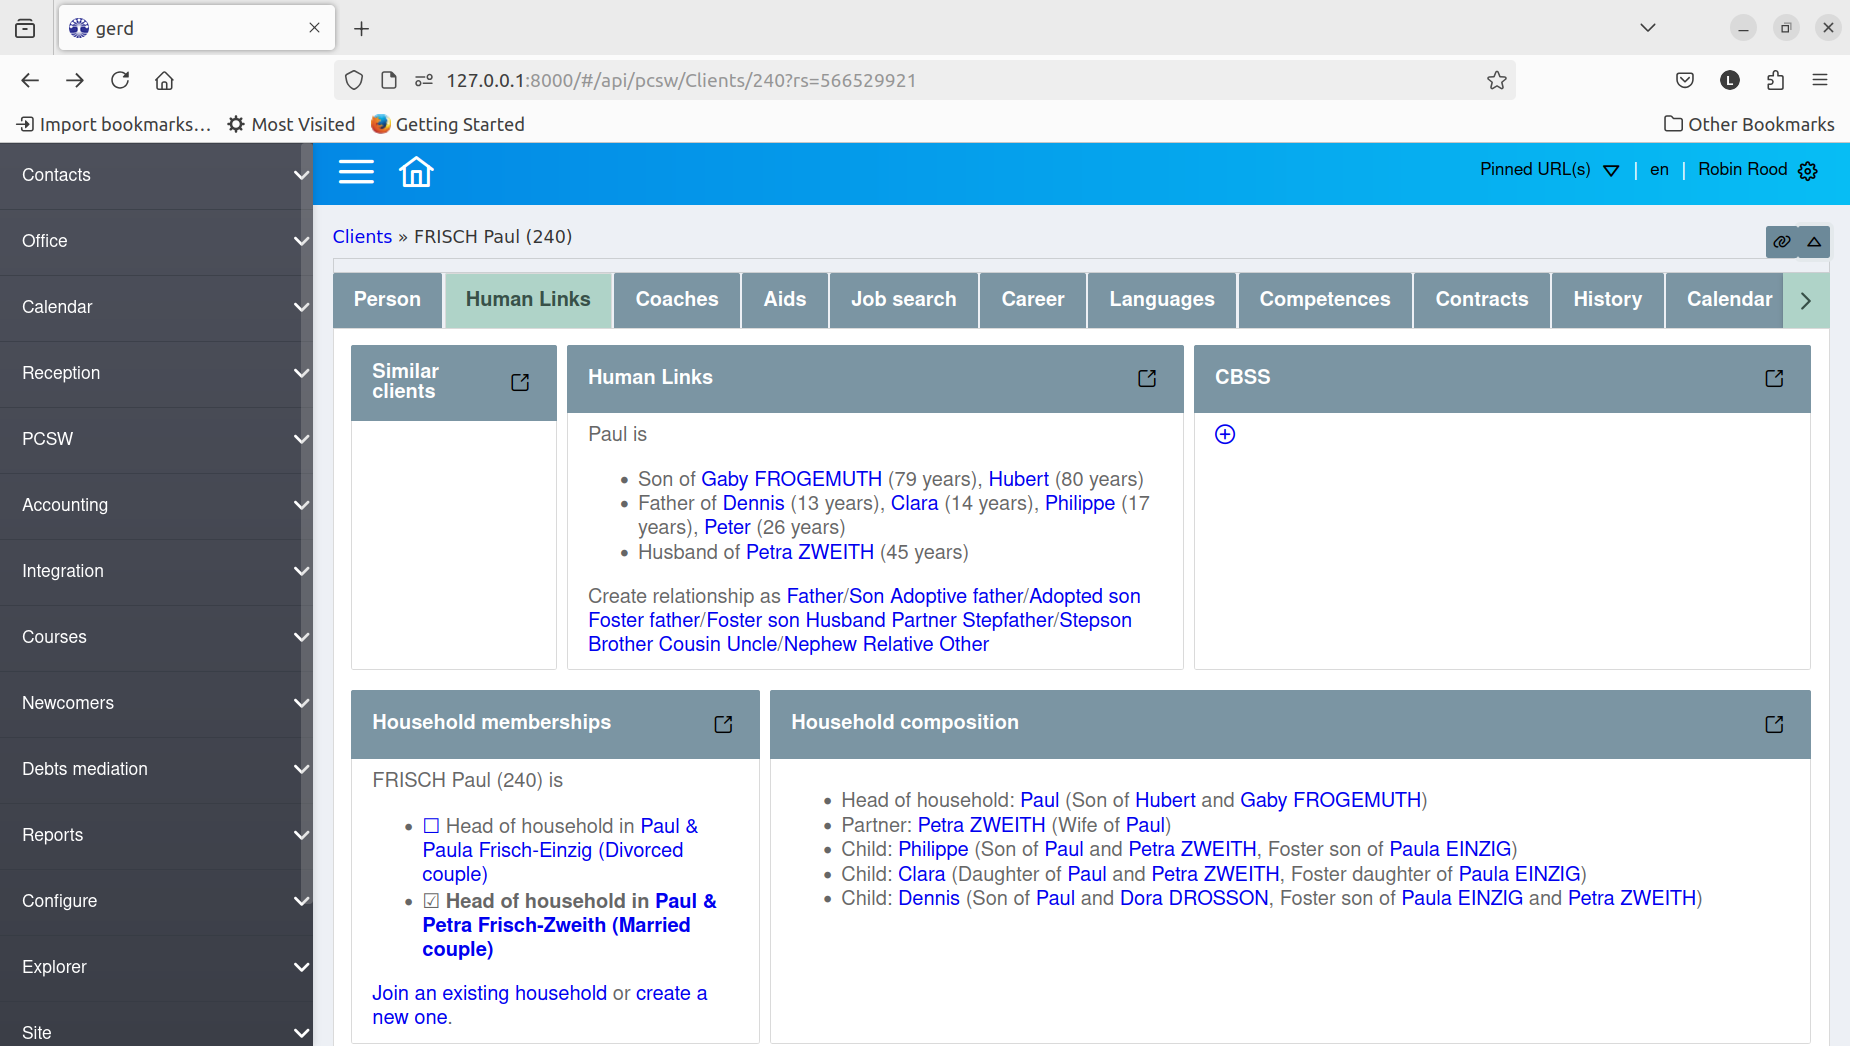
The Human links slave panel displays the summary view of the
SiblingsByPerson table. Look
at the source code of the table_as_summary() method.
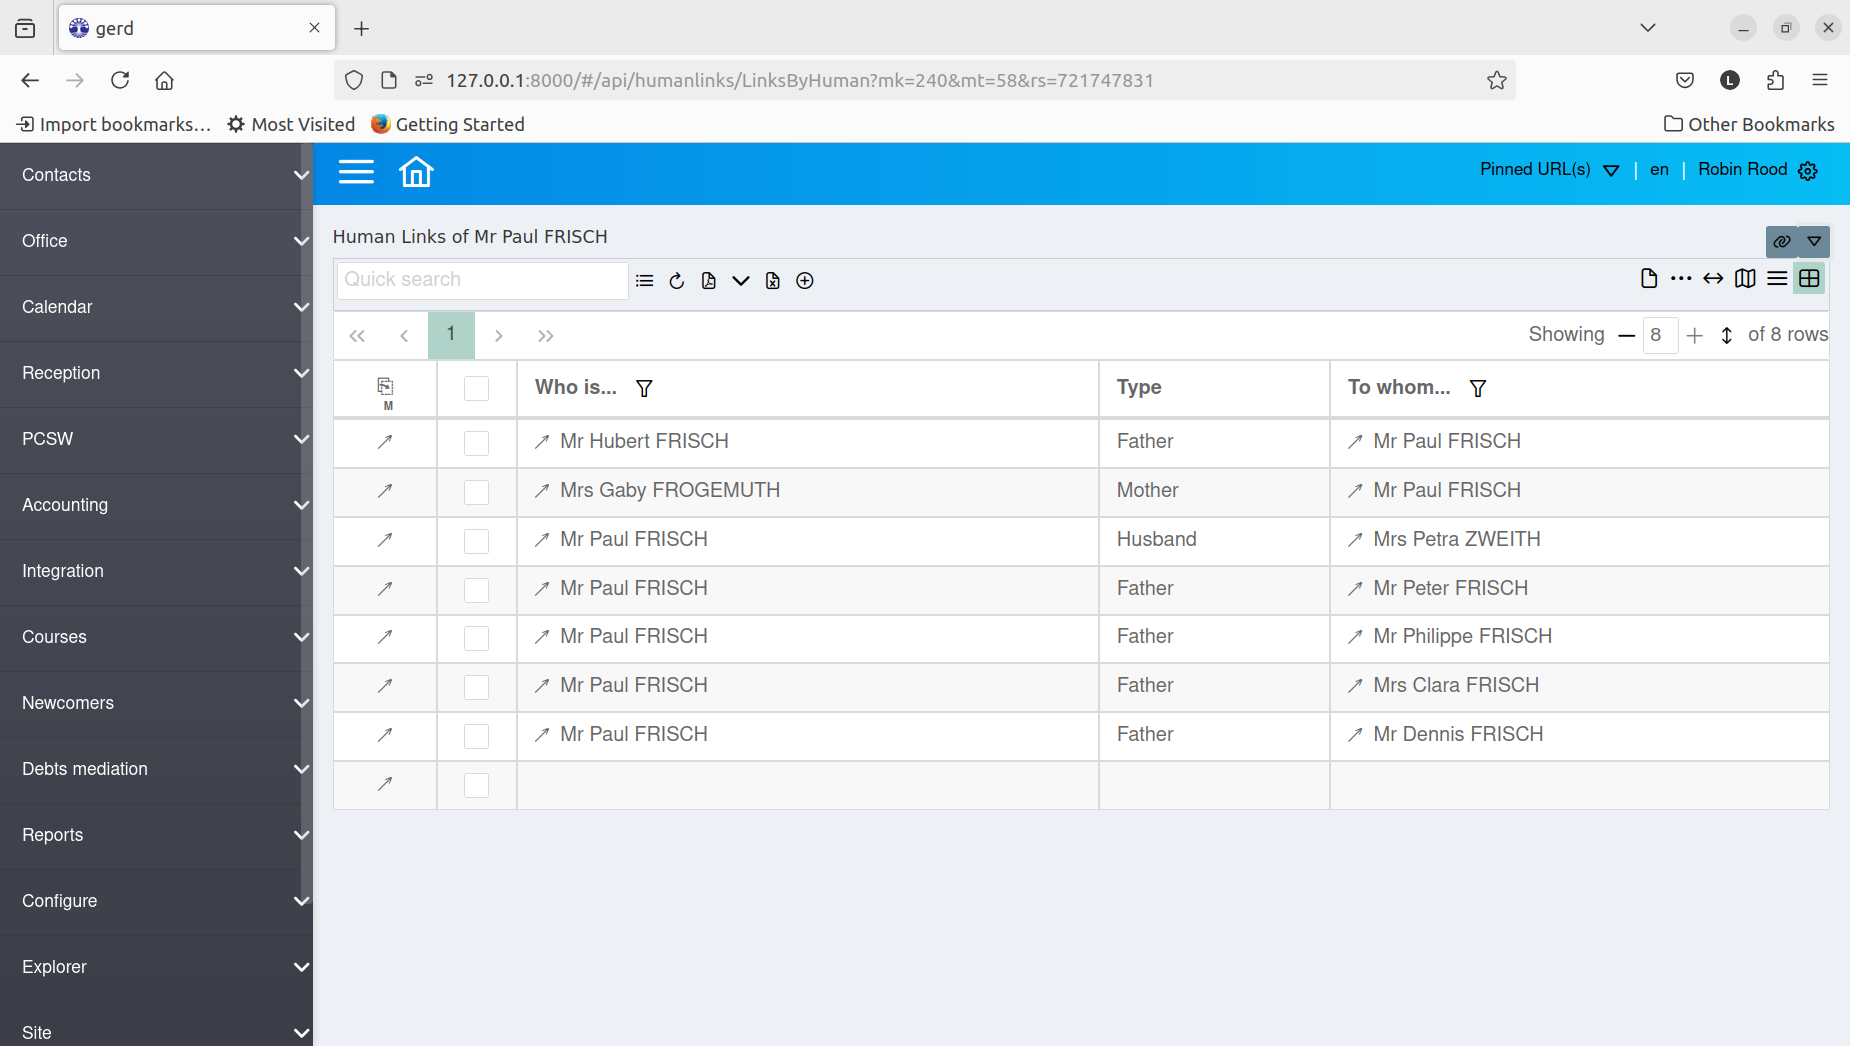
If you click the  button in the header of this panel, you see the
same data in grid mode, titled (“Human Links of Mr Paul FRISCH”):
button in the header of this panel, you see the
same data in grid mode, titled (“Human Links of Mr Paul FRISCH”):
The display mode story
Two usage examples for the display mode “story” are blog entries and comments
(blogs.Entries and
comments.Comments).
Display mode story means to render each item as a whole page. A story can be
long.
In story mode, Lino shows the whole comment or blog entry, in
class Entries(dd.Table):

    default_display_modes = { 70: DISPLAY_MODE_LIST, None: DISPLAY_MODE_STORY }
In the dashboard these tables are rendered in display mode story, but in a
slave panel using list.
Code snippets
>>> ses = rt.login("robin")
>>> ses.show(contacts.Persons, limit=5)
========================== ================================= =================== ============== ======= ==== =========
 Name                       Adresse                           E-Mail-Adresse      Telefon        Handy   ID   Sprache
-------------------------- --------------------------------- ------------------- -------------- ------- ---- ---------
 Herr Hans Altenberg        Aachener Straße, 4700 Eupen                                                  16
 Herr Andreas Arens         Akazienweg, 4700 Eupen            andreas@arens.com   +32 87123456           14
 Frau Annette Arens         Alter Malmedyer Weg, 4700 Eupen   annette@arens.com   +32 87123457           15
 Herr Alfons Ausdemwald     Am Bahndamm, 4700 Eupen                                                      17
 Herr Laurent Bastiaensen   Am Berg, 4700 Eupen                                                          18
========================== ================================= =================== ============== ======= ==== =========
>>> ses.show(contacts.Persons, display_mode="summary")
`[img add] <…>`__ `⏏ <…>`__ | `Herr Hans Altenberg <…>`__, `Herr Andreas Arens
<…>`__, `Frau Annette Arens <…>`__, `Herr Alfons Ausdemwald <…>`__, `Herr
Laurent Bastiaensen <…>`__, `Dr. Bernard Bodard <…>`__, `Herr Bernd Brecht
<…>`__, `Herr Marc Chantraine <…>`__, `Frau Ulrike Charlier <…>`__, `Frau
Charlotte Collard <…>`__, `Frau Dorothée Demeulenaere <…>`__, `Herr Denis Denon
<…>`__, `Herr Daniel Dericum <…>`__, `Frau Dorothée Dobbelstein <…>`__, `Frau
Dorothée Dobbelstein-Demeulenaere <…>`__, ...
>>> ses.show(contacts.Persons, display_mode="list", limit=5)
- (+) Neue(n/s) Person erstellen.

- [Herr Hans Altenberg](…) (Aachener Straße, 4700 Eupen)


- [Herr Andreas Arens](…) (Akazienweg, 4700 Eupen)


- [Frau Annette Arens](…) (Alter Malmedyer Weg, 4700 Eupen)


- [Herr Alfons Ausdemwald](…) (Am Bahndamm, 4700 Eupen)


- [Herr Laurent Bastiaensen](…) (Am Berg, 4700 Eupen)