Welcome | Get started | Dive | Contribute | Topics | Reference | Changes | More
Step 1 : Analysis and first prototype
Database structure
Products : one row for every product or service. We keep it simple and just record the designation for our products. We don’t even record a price.
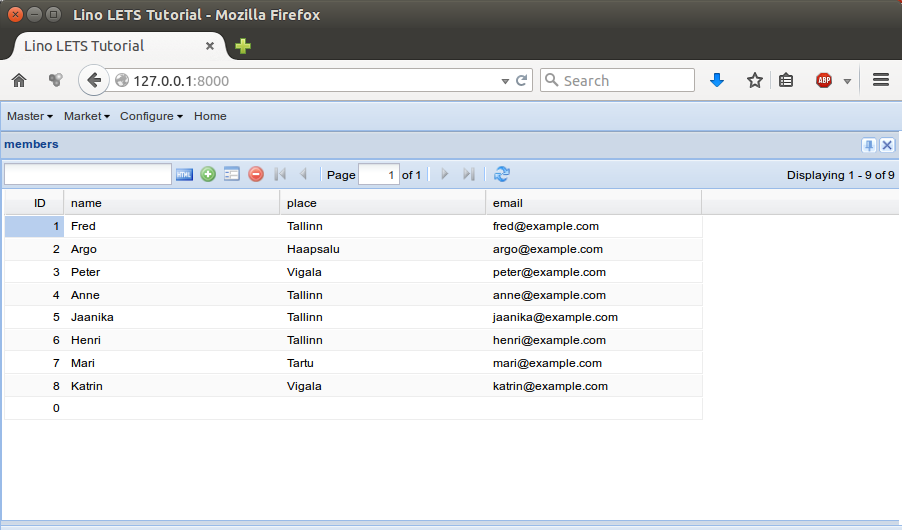
Members : the people who use this site to register their offers and demands. For each member we record their contact data such as place and email.
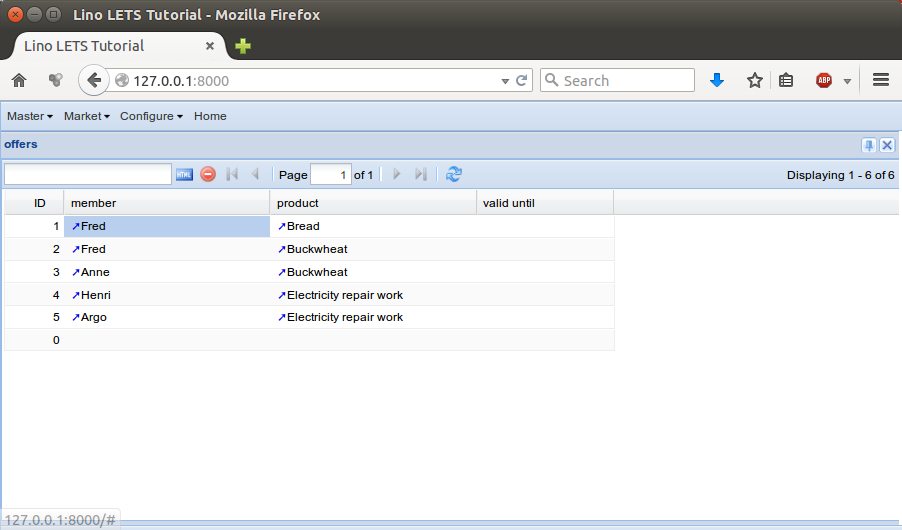
An Offer is when a given member declares that they want to sell a given product.
A Demand is when a given member declares that they want to buy a given product.
Every member is located in a given Place. And in a future version we want to add filtering on offers and demands limited to the place.
Here is a graphical representation of the database structure:
![digraph foo {
graph [renderer="neato"]
node [shape=box]
node [style=filled]
node [fontname="times bold", fillcolor=red]
Product Member
node [fontname="times" fillcolor=gold] Offer Demand
node [fontname="times italic" fillcolor=lightblue] Place
Product -> Offer[arrowhead="inv"]
Product -> Demand[arrowhead="inv"]
Offer -> Member[taillabel="provider", labelangle="-90", labeldistance="2"];
Demand -> Member[taillabel="customer", labelangle="90", labeldistance="2"];
Member -> Place;
}](../../_images/graphviz-f8c95bfc5edcee53d45e6f39fa4a3061df01e1f3.png)
You shoud do such diagrams interactively, together with the customer. Above picture has been realized using graphviz. You might prefer Dia which renders it as follows:
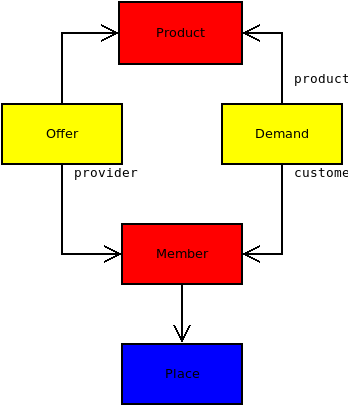
There are many methodologies for visualizing a database model (UML, IDEF1X), and above style is just our favourite because it is so simple, intuitive and useful. The basic rules are:
Every node on the diagram represents a database model.
Every arrow on the diagram represents a ForeignKey. We prefer to use the word pointer instead of ForeignKey when talking with a customer because that’s more intuitive.
We display the name of a pointer only if it differs from the model it points to. For example the arrow from Offer to Product is a FK field called product, defined on the Offer model. We do not display the name product on our diagram because that would be a waste of place.
The colors of this diagram are a convention for grouping the models into three “data categories”:
red is for master data (i.e. relatively stable data)
yellow is for moving data (i.e. data which changes relatively often)
blue is for configuration data (i.e. data which is rather in background and accessible only to site managers)
Writing a prototype
With above information you should be ready to write a “first draft” or “prototype” or “proof of concept”.
For this tutorial we wrote that prototype for you. It is in a repository of its own has been installed as part of the Lino contributor environment. You can run the demo by saying:
$ cd ~/lino/repositories/lets/lets_demo/projects/letsdemo
$ python manage.py prep
$ python manage.py runserver
The code and the docs are in Lino LETS repository.
code: https://gitlab.com/lino-framework/lets/-/tree/master/lino_lets
docs: https://gitlab.com/lino-framework/lets/-/tree/master/docs
Note the difference between “code” and “documentation”. The code directory
contains runnable Python code and application-specific configuration files. A
copy of this would be needed on a production site. The documentation is a
Sphinx documentation tree and contains mainly .rst files. These docs are
not needed on a production site. Their first purpose is to contain tests.
Members
For storing what the customer calls “members”, we decided to use the standard
library plugin lino.modlib.users. But we extend it:
we change the verbose model name from “User” to “Member”
we add a field
place, which is a pointer to our table of places.
Form layouts
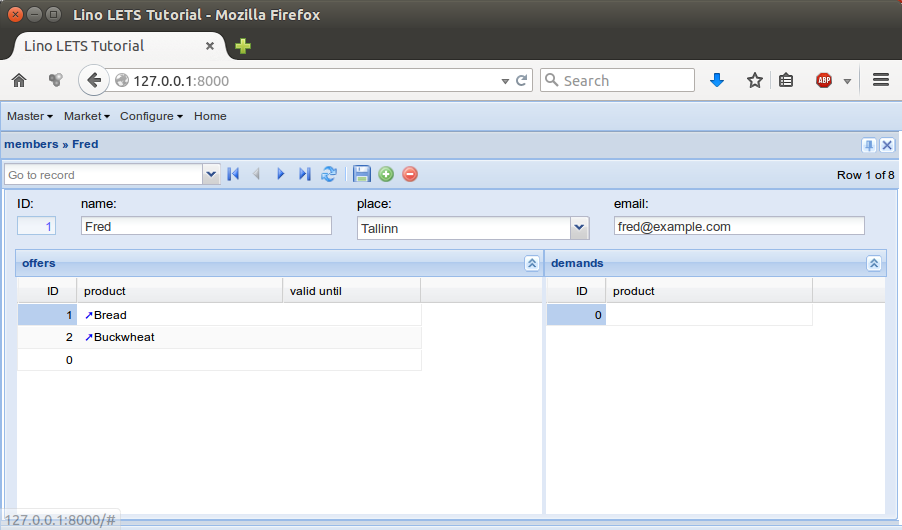
Note the detail_layout attributes of certain tables. They define the layout of the detail window for these database models (a detail window is what Lino opens when the user double-clicks on a given row).
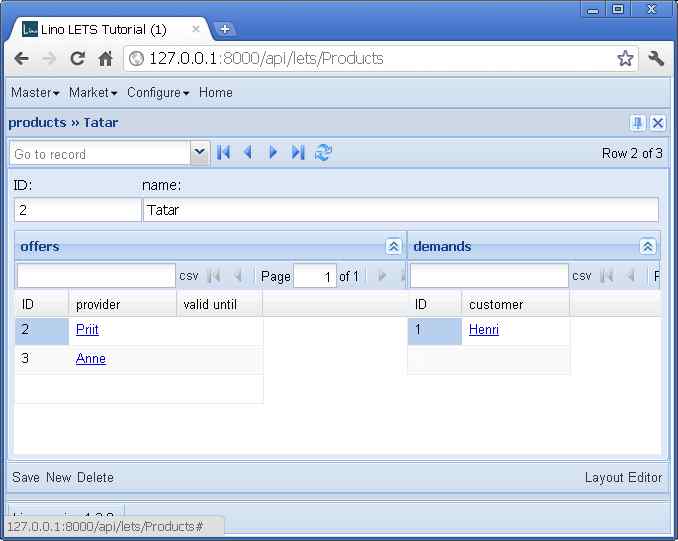
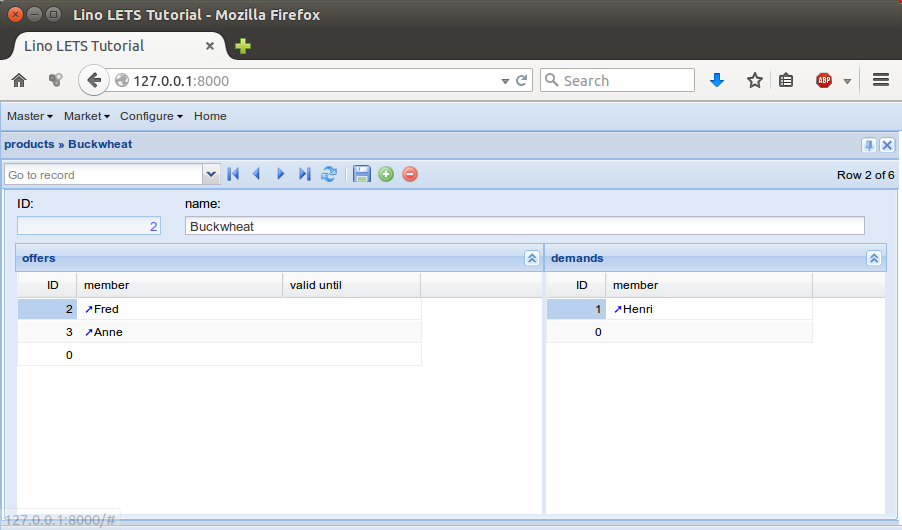
The detail window of a Product should show the data fields and two slave tables, one showing the the offers and another with the demands for this product.
Here is the application code that produces the picture on the right
detail_layout = """
id name
OffersByProduct DemandsByProduct
"""
The dashboard
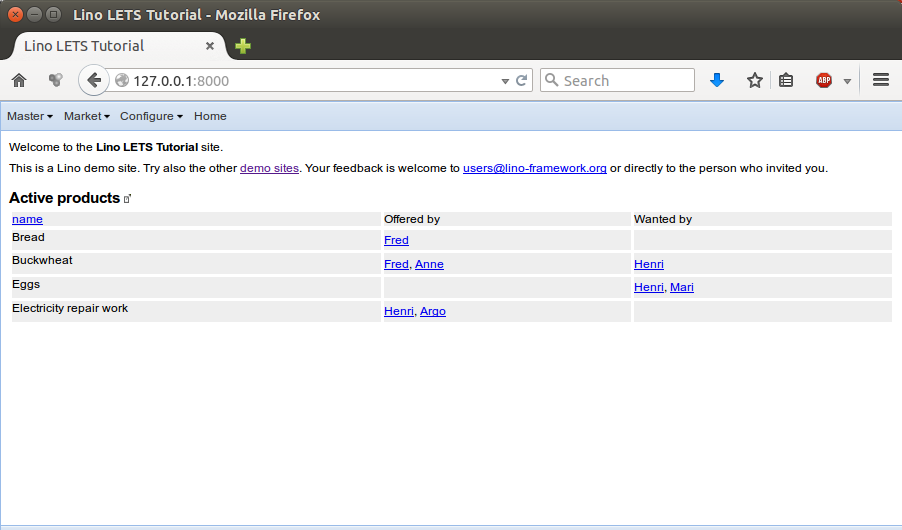
The dashboard shows the ActiveProducts table. The definition of that table is
here,
and the get_dashboard_items method is defined
here)
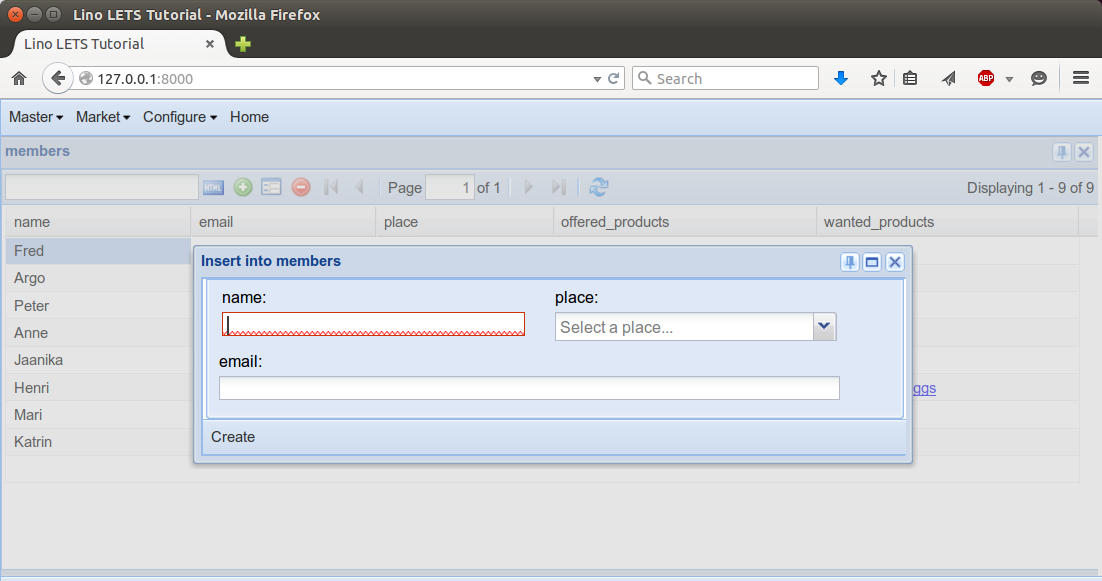
More screenshots
Here are some screenshots.